Data visualization
Grafana
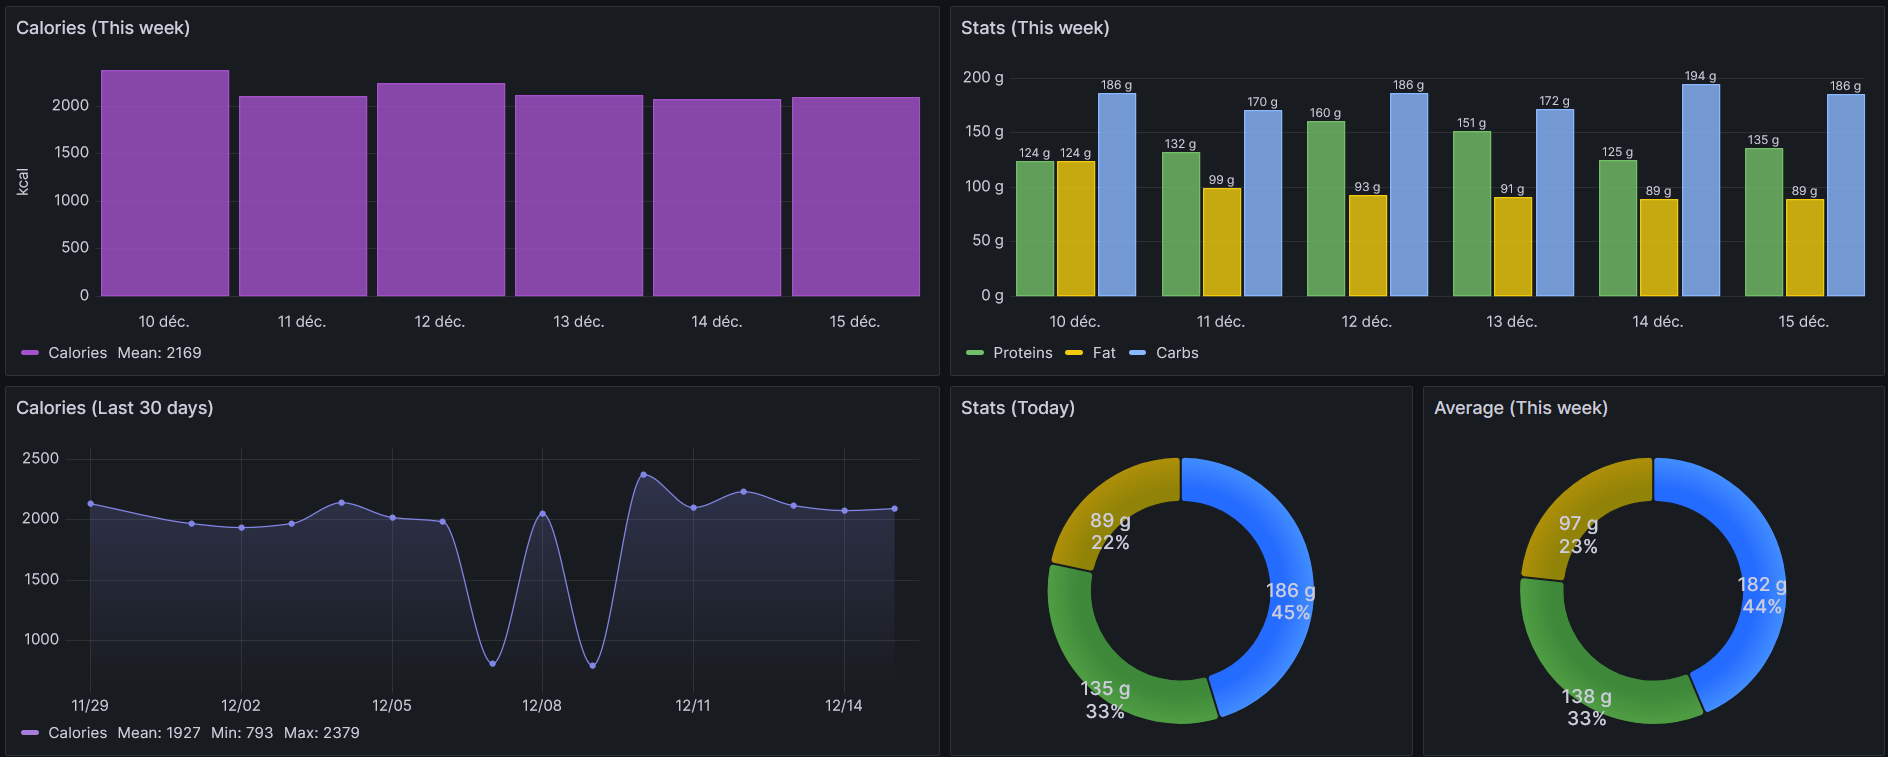
Grafana is a powerful tool for visualizing data, with a user-friendly interface and offering a lot of customization options.
You can easily set up a Dashboard to see your live data using the stats API endpoint.
Data privacy
If you are worried about sharing your data with Grafana.com, you can also self-host this service.
Data source
To add the API as a data source, you should use the plugin JSON API.
You only have to set the URL in the "Connection" section to <APP_BASE_URL>/api/v1/stats and to add this header in the "HTTP headers" section:
| Header | Value |
|---|---|
Authorization |
ApiKey <YOUR_API_KEY> |
Dashboard
I created a template you could use to create your dashboard, but you could create yours from scratch, if you prefer.
Import a dashboard
On the dashboard page, click on "New" then "Import".
Click on "Upload dashboard JSON file" and put this file : docs/files/grafana.json.
You should be able to select the "waistline-api-datasource" where you can select the connection with the JSON API plugin we set earlier.
Your dashboard must be working properly, and you should see the data from your API!